4.1 Output Curves to Separate Grids
This section of the tutorial explains the process of automatically outputting curves to separate grids. While there are several ways to interactively move curves to new grids on the waveform viewer (e.g. ), these methods need to be run after every simulation. Instead of describing the interactive methods, this topic focuses on automatically making these measurements by adding the measurement definitions to the fixed probes.
In this topic:
Key Concepts
This topic addresses the following key concepts:
- Why you might want to display curves on separate grids.
- The SIMetrix/SIMPLIS software does not graph vectors with different physical units on the same axis; instead it creates a new axes for each different physical unit.
What You Will Learn
In this section, you will learn to the following:
- Why you might want waveforms on separate grids.
- How to output curves to separate grids.
In the graph output from 3.3 Set up an AC Analysis, you had two tabs: simplis_pop1 VOUT (Y1) and simplis_ac1, these are the data groups created by SIMPLIS.
If you click on the simplis_pop tab, you should see three curves on one grid with two axes, as shown below.
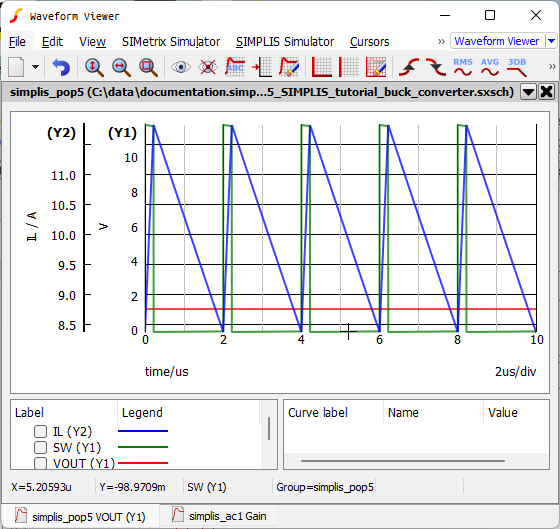
Notice in the illustration above that the voltages are grouped on Y1 axis and the currents are on the Y2 axis since each physical unit requires its own axis.
With all three curves on one grid (VOUT in red, SW in green, and IL in blue), understanding the converter behavior and performance is difficult. For example, the 1.2V output voltage appears to be a flat line when plotted on the same axis as the SW waveform because the relative magnitude of the SW node waveform is much larger. It makes sense to split the waveforms onto multiple axes, or grids, so that the curves with similar amplitudes or functions are grouped together.
4.1.1 Separate Curves onto Individual Grids
To separate the curves onto grids with one curve per grid, follow these steps:
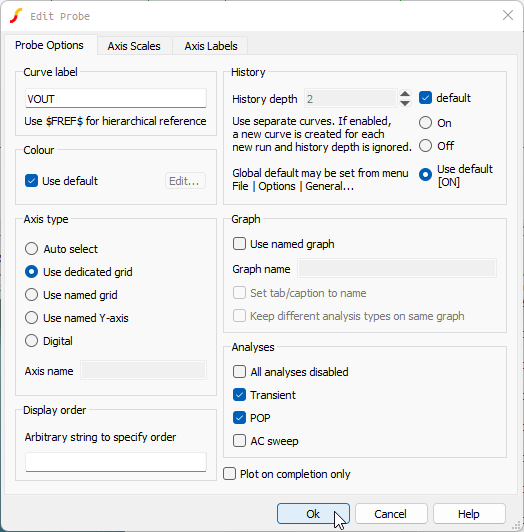
- Close the open waveform viewer; return to the schematic editor, and double click on
the VOUT probe.Result: The Edit Probe dialog opens.
- In the Axis type section, select Use dedicated grid, and then click
Ok.
- Press F9 to rerun the simulation.
- In the waveform viewer, click on the simplis_pop... tab.Result: The output voltage, VOUT, is now on a new grid and auto-scaled to fit the waveform.
- Close the waveform viewer; return to the schematic editor, and double click the IL probe.
- In the Axis type section, select Use named grid.
- In the Axis name field, type currents.
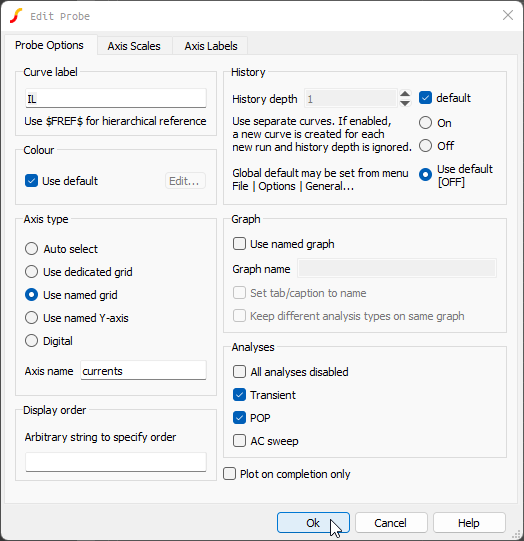 Note: Adding an axis name ensures that the inductor curve does not appear in the same grid with VOUT.
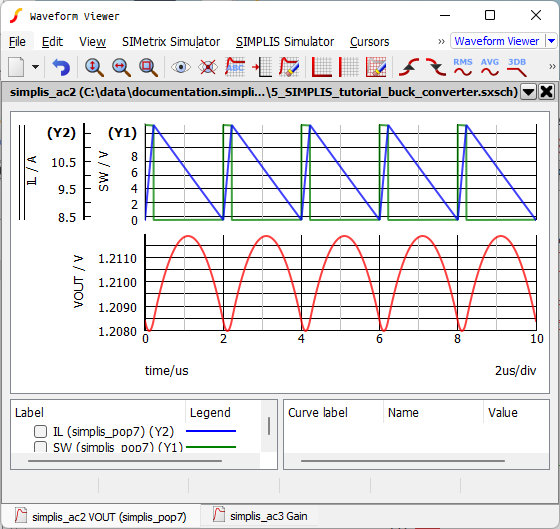
 - Press F9 to rerun the simulation.Result: Now you have each curve on a separate grid as shown below.
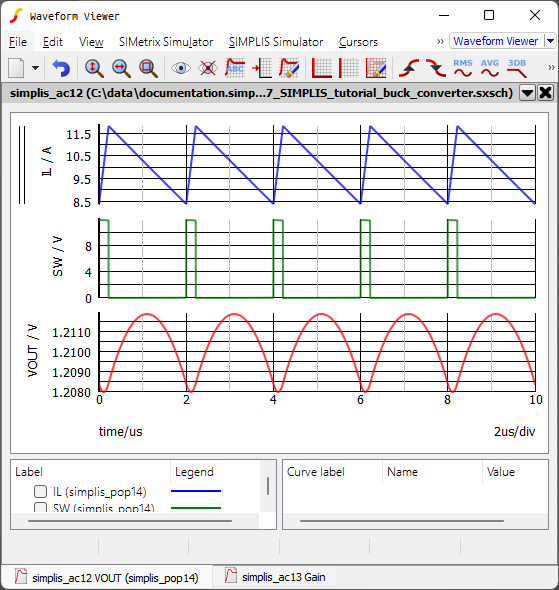
4.1.2 Saving your Schematic
To save your schematic, follow these steps:
- Click anywhere in the schematic to bring the schematic viewer in to focus.
- From the menu bar, select .
- Navigate to your working directory where you are saving your schematics.
- Name the file 7_my_buck_converter.sxsch.
A schematic saved at this state can be downloaded here: 7_SIMPLIS_tutorial_buck_converter.sxsch.
In the next section, you will change the order of the grids.