AC/DC Harmonic Specifications
This topic describes how the spectral content of the AC input source is calculated and how those results are affected by the simulation timing parameters. Additionally, you can customize harmonic limits used for specification checking.
In this topic:
After every AcSteadyState() Test Objective simulation, DVM can measure, plot, and compare results to specifications for the first 40 harmonics of each DVM input source. From the AC Steady-State page in the DVM control symbol dialog box, you select the operations to perform.
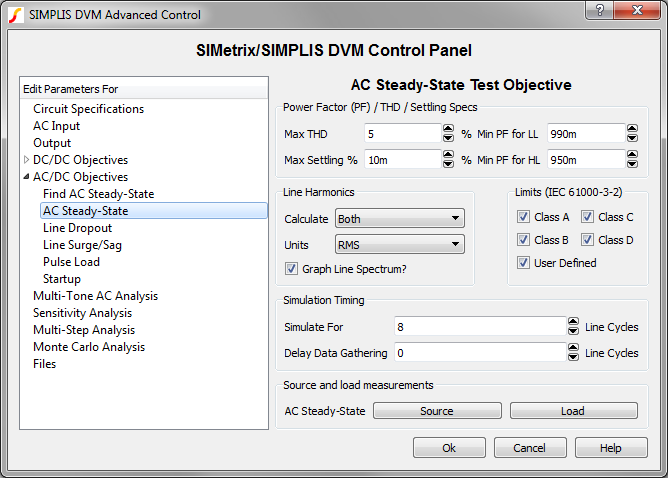
This configuration is flexible, allowing you to individually select operations that customize the test-report format from the dialog above. You can select any or all of the following:
- Log the scalar values of each harmonic, using the Calculate drop down list.
- Output the harmonic values on a spectrum plot by checking Graph Line Spectrum?.
- Compare the measured scalar values to specifications by checking options in the Limits (IEC61000-3-2) group box.
- Define the simulation start and stop times in the Simulation Timing section. For more information, see Simulation Timing below.
The Fast Fourier Transform (FFT) method is used to calculate the harmonic content of the input source supplied as an argument to the AcSteadyState() Test Objective. The FFT returns results which are a close approximation of harmonic content without the time-consuming continuous Fourier method. The FFT algorithm used by DVM uses a 'Hanning' window and a 2nd-order interpolation. For most offline converters with a line filter, this algorithm produces reliable results. The intricacies of the FFT algorithm can fill volumes and are, therefore, not detailed here.
Simulation Timing
You define the simulation start and stop times for the AcSteadyState() Test Objective from the Simulation Timing section of the DVM control symbol.
The number of line cycles simulated affects the appearance (but not the accuracy at the harmonic frequencies) of the Spectrum plot. The default simulation times are as follows:
- Simulate = 9 line cycles
- Delay Data Gathering = 1 cycle
These default values give 8 line cycles of data for the FFT algorithm to calculate the spectrum. The Fourier resolution is determined directly by the number of line cycles: \[ \text{Fres} = \frac{\text{Frequency}}{\text{NCycles}} \]
With the default NCycles = 8, this produces a reasonably detailed spectrum while minimizing the simulation time required.
Be aware that a trade off exists between the time required to simulate the converter and the resolution of the FFT spectrum. This is best visualized with the FFT Spectrum plot below which is taken from simulation runs with 1, 2, and 8 line cycles:
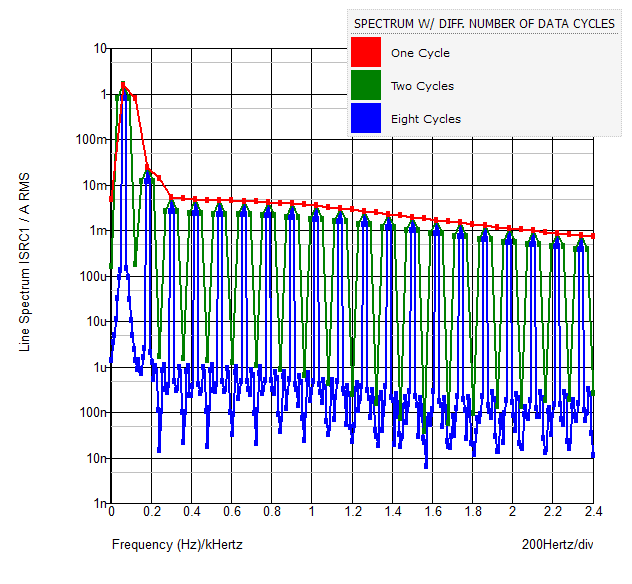
Two conclusions are reached from this plot:
- The accuracy of the odd-order harmonics is largely unaffected by the number of line cycles present in the simulation data.
- The even-number harmonics (including DC) are over-represented in the FFT plot when the number of line cycles is low. Since the reported scalar values are taken from the plotted data, accuracy of even-order harmonics can be guaranteed only if more than one line cycle is simulated.
Finally, in order to have accurate results from the FFT, the circuit must be completely settled. Usually this is accomplished through the IncludeInitFile column, which uses a SIMPLIS .init file generated in an earlier test run. If, however, that file is inaccurate or if the circuit requires some time to settle, you can edit the Simulation Timing parameters on the DVM control symbol and increase the number of cycles in the Delay Data Gathering field and increase the Simulate parameter, which yields good harmonic spectrum results.
Harmonic Spec File Location
The specifications for each IEC61000-3-2 harmonic limit class (Class A, Class B, etc.) as well as any user defined limits are stored in a tab-separated file named harmonic_specs.def. The master version of this file is included in the support\dvm folder of your SIMetrix/SIMPLIS installation directory.
After running your first AcSteadyState() Test Objective simulation, DVM copies this file from the installation directory to your schematic's working directory, assuming that the file does not already exist. This local file then becomes the source for all harmonic limits for schematics run from that directory.
Alternately, you can add a property to the DVM control symbol that specifies a full file path and name. To add this property, do the following:
- Select the DVM control symbol on your schematic, right click, and select Edit/Add Properties.
- Follow the dialog directions to select the following property and specify the full path and file name. ANALYSIS_AC_STEADY_STATE_LINE_SPECTRUM_HARMONICS_SPECS._FILE
After you add this property, the specification file will be sourced from the path defined by the property value. Using the full path and filename is mandatory.
Harmonic Spec File Syntax
Each column of the harmonic specification file contains the information required to define a complete set of harmonic limits with following format:
- Enter the Display Name in the first row.
- Define the Units on the second row.
- Start the Scalar Limit Values by p lacing DC on row three.
- Enter the 1st harmonic on row four and continue to the 40th harmonic limit value on row 43.
Syntax Rules
Follow these rules to obtain the proper syntax:
- The first column is reserved for future use and should not be edited.
- Display Name can be any string and can include spaces. This name will appear in the test report "Measured Spec Values" and on the graphs.
-
Units must be one of three case-sensitive strings:
- A_RMS
- %_Fundamental
- mA/W
- DC values in row 3 are not checked against limits; however, the mean voltage and current of the sources are measured and logged in the scalar table.
- The Scalar Limit Values are entered using the units specified in the 2nd
row.
- For percentages, the number 100 represents 100%.
- Any negative scalar limit value will not be checked against the measured value nor will that limit value be graphed.
- The table must be "square" with all entries filled in. Use -1 for untested values.
- Every column after the 5th is assumed to be a new set of user harmonic limits.
- You can change the definitions in all columns from the second (Class A) through
the right-most user-defined limit. This allows you to change the definition of the
IEC limits, including both the Display Name and the limit values; however, the DVM
control symbol labels remain unchanged.
For example, if you change the Display Name to "my limits1" in the second column where it was "Class A Harmonic Limits," the checkbox for Class A in the dialog box will still have the label, "Class A". The actual harmonic limit values are always taken from the harmonic specs table.
Being able to change the limits can be useful; for example, if the converter under test draws more than 16A per phase and the harmonic limits for IEC 61000-3-12 need to be checked, you need to enter only the values in the table; and DVM will use those values for specification checking and determine the PASS/FAIL status accordingly.
User-Defined Limits
The first set of user-defined limits is entered in the 6th column. Since the columns are tab separated, editing with a spreadsheet program is recommended. User-defined limits can have any of the three units (A_RMS, %_Fundamental, mA/W) and are both plotted and checked against measured values if User Defined is checked in the DVM control symbol dialog. Note that all user limits, from the 6th column to the right-most column, are verified if "User Defined" is checked.
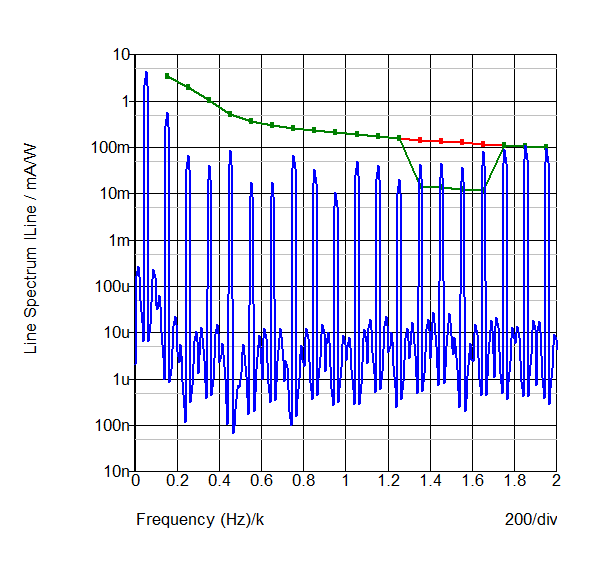
The user-defined limits from the harmonic specs file will be plotted on graphs with the appropriate units. If you check User Defined in the DVM control symbol dialog, multiple graphs will be plotted. For example, if there are two user-defined limit columns with units A_RMS and mA/W, two spectrum graphs will be generated in the test report with one for each unit. Additionally, if the IEC limit is checked and that limit has the same units as the user-defined limits, both limit curves will be plotted on the same spectrum graph. This allows you to easily see how the user-defined limits compare to the IEC limits.
Example harmonic_specs.def file
You can download a copy of a user-configured harmonic specs file here: harmonics_specs.def. This file is also shown in the table below:
| Harm# | Class A Harmonic Limits | Class B Harmonic Limits | Class C Harmonic Limits | Class D Harmonic Limits | User Notch Limits |
| *** | A_RMS | A_RMS | %_Fundamental | mA/W | mA/W |
| 0 | -1 | -1 | -1 | -1 | -1 |
| 1 | -1 | -1 | -1 | -1 | -1 |
| 2 | 1.08 | 1.62 | 0.02 | -1 | -1 |
| 3 | 2.3 | 3.45 | 0.3 | 3.4 | 3.4 |
| 4 | 0.43 | 0.645 | -1 | -1 | -1 |
| 5 | 1.4 | 1.71 | 0.1 | 1.9 | 1.9 |
| 6 | 0.3 | 0.45 | -1 | -1 | -1 |
| 7 | 0.77 | 1.155 | 0.07 | 1 | 1 |
| 8 | 0.23 | 0.345 | -1 | -1 | -1 |
| 9 | 0.4 | 0.6 | 0.05 | 0.5 | 0.5 |
| 10 | 0.184 | 0.276 | -1 | -1 | -1 |
| 11 | 0.33 | 0.495 | 0.03 | 0.35 | 0.35 |
| 12 | 0.153333333 | 0.23 | -1 | -1 | -1 |
| 13 | 0.21 | 0.315 | 0.03 | 0.296153846 | 0.296153846 |
| 14 | 0.131428571 | 0.197142857 | -1 | -1 | -1 |
| 15 | 0.15 | 0.225 | 0.03 | 0.256666667 | 0.256666667 |
| 16 | 0.115 | 0.1725 | -1 | -1 | -1 |
| 17 | 0.132352941 | 0.198529412 | 0.03 | 0.226470588 | 0.226470588 |
| 18 | 0.102222222 | 0.153333333 | -1 | -1 | -1 |
| 19 | 0.118421053 | 0.177631579 | 0.03 | 0.202631579 | 0.202631579 |
| 20 | 0.092 | 0.138 | -1 | -1 | -1 |
| 21 | 0.107142857 | 0.160714286 | 0.03 | 0.183333333 | 0.183333333 |
| 22 | 0.083636364 | 0.125454545 | -1 | -1 | -1 |
| 23 | 0.097826087 | 0.14673913 | 0.03 | 0.167391304 | 0.167391304 |
| 24 | 0.076666667 | 0.115 | -1 | -1 | -1 |
| 25 | 0.09 | 0.135 | 0.03 | 0.154 | 0.154 |
| 26 | 0.070769231 | 0.106153846 | -1 | -1 | -1 |
| 27 | 0.083333333 | 0.125 | 0.03 | 0.142592593 | 0.014259259 |
| 28 | 0.065714286 | 0.098571429 | -1 | -1 | -1 |
| 29 | 0.077586207 | 0.11637931 | 0.03 | 0.132758621 | 0.013275862 |
| 30 | 0.061333333 | 0.092 | -1 | -1 | -1 |
| 31 | 0.072580645 | 0.108870968 | 0.03 | 0.124193548 | 0.012419355 |
| 32 | 0.0575 | 0.08625 | -1 | -1 | -1 |
| 33 | 0.068181818 | 0.102272727 | 0.03 | 0.116666667 | 0.011666667 |
| 34 | 0.054117647 | 0.081176471 | -1 | -1 | -1 |
| 35 | 0.064285714 | 0.096428571 | 0.03 | 0.11 | 0.11 |
| 36 | 0.051111111 | 0.076666667 | -1 | -1 | -1 |
| 37 | 0.060810811 | 0.091216216 | 0.03 | 0.104054054 | 0.104054054 |
| 38 | 0.048421053 | 0.072631579 | -1 | -1 | -1 |
| 39 | 0.057692308 | 0.086538462 | 0.03 | 0.098717949 | 0.098717949 |
| 40 | 0.046 | 0.069 | -1 | -1 | -1 |
In this example, the a 6th column provides the name User Notch Limits, which have the units of mA/W. The limits from the Class D limit column were copied and the limits for the 27th, 29th, 31st and 33rd harmonics were decreased by 20dB. This notch is present on the output graph from this simulation. The red curve is the Class D limit, and the green curve is the User Notch Limits: