4.3 Define Waveform History
This section of the tutorial describes how many simulation runs of data are displayed on the waveform viewer. Since SIMetrix/SIMPLIS version 8.2, this is controlled by the history depth value, which has both a global setting and a local setting on each probe. Which history depth value is used can be set on a probe-by-probe basis.
In this topic:
Key Concepts
This topic addresses the following key concepts:
- The waveform history depth determines how many simulation runs are displayed on the waveform viewer for each probe.
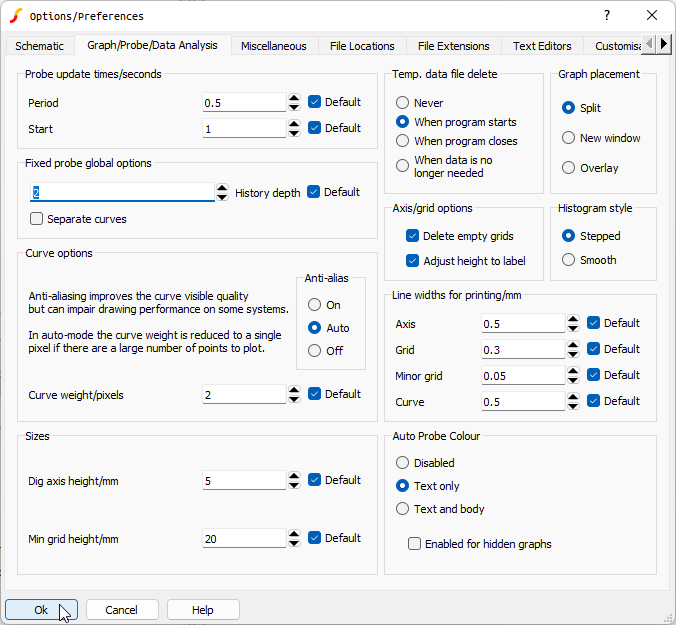
- The global history depth value is defined in the Graph/Probe/Data Analysis section of the General Options dialog. The default value is 2.
What You Will Learn
In this topic, you will learn the following:
- How to change the global value of the waveform history depth.
- How to change the waveform history depth value for an individual probe.
- How to plot separate curves for each simulation run.
4.3.1 Change the Global History Depth Value
To change the default value of 2, follow these steps:
- From the menu bar, select .Result: The Options/Preferences dialog box opens showing the Schematic options tab.
- Click the Graph/Probe/Data Analysis tab.
- In the second section on the left, Fixed probe global options, next to the
History Depth label, use the arrow buttons to increase the number.
or
Select the 2 and type the number of runs you want to retain.
- Click Ok.
4.3.2 Change the History Depth on a Probe
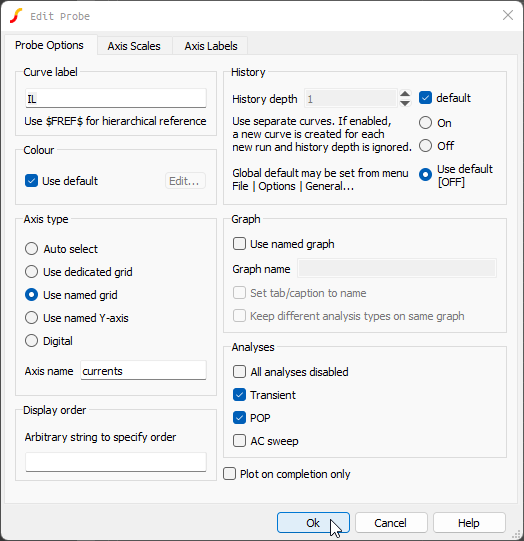
In the upper right corner of he Edit Probe dialog is a History field, which normally has the default checkbox checked. On each probe you can specify the history depth or use the global history depth value defined in the General Options dialog. This flexibility allows you to customize how many curves are displayed on the waveform viewer, on a probe by probe basis.
For most applications using the default history depth makes the most sense, which allows a single control on the General Options dialog to manage the history depth of all probes.
To change the waveform history depth for a individual probe, follow these steps:
- In the schematic editor, double click the IL probe. Result: The Edit Probe dialog opens with default checked in the History section as shown below.

- In the History section, uncheck default, and then use the arrow buttons to increase or decrease the number.
- Click Ok.