Graph Cursors
In this topic:
Overview
Graph cursors can be used to make measurements from waveforms. In their default configuration they consist of two dimensioned crosshairs as shown below:
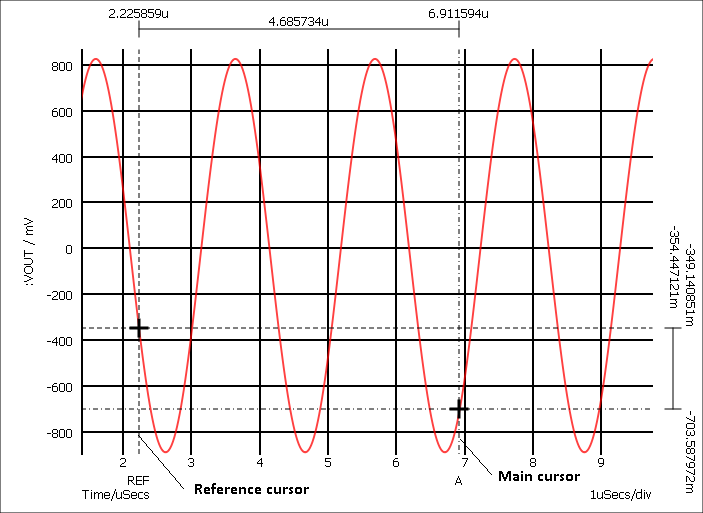
The cursors can be moved horizontally or vertically while tracking an attached curve or they can be picked up and dragged onto another curve.
Initially there are just two cursors, but there is the facility to add additional cursors without any maximum limit.
Cursor Operations
Displaying
To switch on/off the cursor display select the graph menu
Moving
Cursors can be moved by a number of methods:
- Left to right. In this mode the x-position of the cursor is varied while the cursor tracks the curve to which it is attached. To use this method, place the mouse on the vertical crosshair but away from the intersection with the horizontal crosshair. You should see the mouse cursor shape change to a left-right arrow. Press left mouse key and drag.
- Up-down. Similar to 1. above but instead the y-position is varied. To use this method, place the mouse on the horizontal crosshair but away from the intersection with the vertical crosshair. You should see the mouse cursor shape change to an up-down arrow. Press left mouse key and drag.
- Drag and drop. In this mode the cursor is picked up and moved without tracking any curve. It can be dropped to any location and will then snap to the nearest curve. To use this method, place the mouse cursor at the intersection of the crosshairs. You will see the cursor shape change to a four-pointed arrow. Press left key and drag to new location.
- The reference cursor can be moved in a left-right mode using the right mouse button.
- Both cursors can be moved together using the left button while holding down the shift key.
Moving Cursors along a Curve
You can move a cursor to a peak or trough using the hot-key defined in the following table
| Key | Function |
| F5 | Move main cursor to next peak |
| shift-F5 | Move main cursor to previous peak |
| F6 | Move main cursor to next trough |
| shift-F6 | Move main cursor to previous trough |
| F7 | Move reference cursor to next peak |
| shift-F7 | Move reference cursor to previous peak |
| F8 | Move reference cursor to next trough |
| shift-F8 | Move reference cursor to previous trough |
Hiding Cursors
You can temporarily hide all or some of the displayed cursors. Menu has a toggle action and will hide all cursors if all cursors are currently displayed and vice-versa. If some cursors are visible and some are hidden, you will be presented with an option to hide all cursors or show all cursors.
Menu allows you to selectively hide or show some cursors.
Freezing Cursors
You can freeze the cursors so that they can't be moved accidentally. Select menu .
Aligning Cursors
Select menu to align the two cursors so that they have the same y position.
Additional Cursors
SIMetrix has the ability to display any number of cursors, not just the standard two.
To Add an Additional Cursor
- Select menu Add Additional Cursor...
- Enter a suitable label for the cursor. This is displayed at the bottom of the graph and to avoid clutter, we recommend that you use a short label such as a single letter.
- Select to which other cursor you wish the new cursor to be referenced for both horizontal and vertical dimensions. Select '**none**' if you do not wish it to be referenced to any currently displayed cursor. Note that you may reference further additional cursors to this one if desired.
- Click Ok. The new cursor will be initially displayed at the start of the x-axis and attached to the first curve on the sheet. You may subsequently move it as desired.
To Remove Additional Cursors
- Select ...
- Select the cursor or cursors to be removed. These are identified by their labels.
Cursor Readout
There are a number of options as to how the cursors' absolute and relative positions are displayed. Initially all values are displayed as dimensions on the graph. This can be altered in a number of ways:
- You can opt to have just the absolute or just relative readings displayed
- The actual format of the graph readout can be customised. E.g extra text can be added, perhaps something like 'Delay = xxxnS' where xxx is the relative reading.
Editing Style or/and Format of Cursor Dimension
Double click on one of the displayed values of the cursor dimension. The following dialog will open:
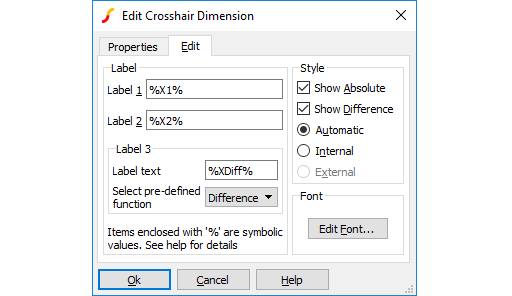 Edit values as described below:
| Label | The labels are the three values displayed on the dimension. Label 1 is the value displayed above the reference cursor, label 2 is the value displayed above the main cursor and label 3 is the value displayed as the difference. %x1%, %x2% and %xdiff% are symbolic values that will be substituted with the absolute position of the reference cursor, the absolute position of the main cursor and the difference between them respectively. You can add additional text to these. For example, if you changed label 1 to 'Pulse Start = %x1%' the value displayed for the position of the reference cursor would be prefixed with 'Pulse Start = '. You can use the pre-defined function drop-down box to choose some commonly used symbolic values and expressions. You can use expressions relating constants and symbolic values enclosed by '%'. Expressions must be enclosed in braces: '{' and '}'. For example, the expression {1/%xdiff%} will cause the difference value to be displayed as a reciprocal. This is useful if you wanted to display a frequency instead of a period. For a detailed description of this feature, see Graph Symbolic Values. You can use any arithmetic operator along with many of the functions described in the Script Reference Manual/Function Reference in these expressions. | ||||||
| Style |
|
||||||
| Font | Select font used for readout text. | ||||||
| Properties Tab | Properties Tab The properties tab lists all available properties of the CrosshairDimension object. This will probably only be of interest if you are writing custom scripts to manipulate cursor dimensions. More information on this subject can be found in the Script Reference Manual/Applications/Grph Objects. |
Show Curve Info
The menu will display in the command shell information about the curve which currently has the main cursor attached. The following information is listed:
| Curve name | |
| Source group | The name of the simulation group that was current when the curve was created. |
| Curve id | Only required when accessing curves using script commands. |
| Run number | If there are multiple curves generated by a Monte Carlo run, this is a number that identifies the run number that created the curve. This number can be used to plot the curve alone and also to identify the seed value used for that Monte Carlo step. |
Cursor Functions
There are four functions which return the current positions of the cursors and these can be used in script expressions. These are
- XDatum()
- YDatum()
- XCursor()
- YCursor()
See Script Reference Manual/Function Reference for details.
| ◄ Curve Operations | Curve Measurements ▶ |